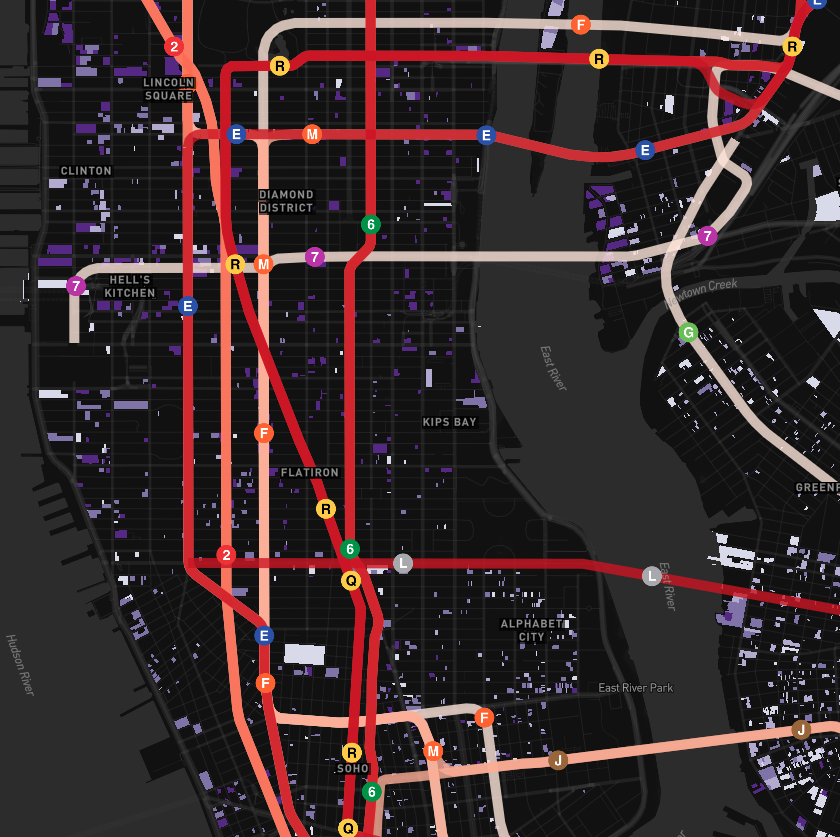
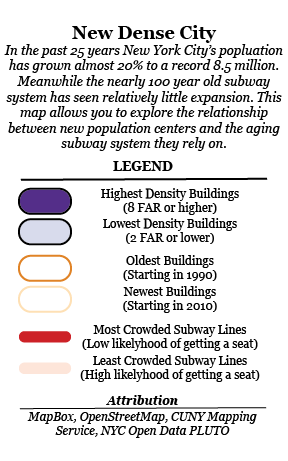
As my final for Everything is Physical, I decided to map new construction in New York City alongside the subway system. The goal was to allow users to explore the relationship between subway crowding and new construction. Ultimately I was able to get the data I wanted into a Mapbox map and style it in a way that made it functional, however I had difficulty adding in interactive features and putting in elements like a legend. Here is the final product:
I spent a lot of time working with the NYC pluto data and attempted to map it with leaflet, Mapbox (in its many variations), and cartoDB. The combination of dealing with a very large data set and my unfamiliarity CSS made it difficult to troubleshoot when I ran into problems. Ultimately I am happy with the result but would have obviously preferred to include the legend and some more interactivity and data exploration.
Having used ArcGIS extensively in the past I think I approached this project the wrong way. It seems to me now that, in terms of my own understanding, it would have been better to plan out what I wanted the interaction to be like first and then considered data second. That being said I think I have a good foundation to keep learning from.