Final Idea Don’t Honk Street Sign – PComp #8

In thinking about my PComp final I’ve come up with an idea for a honk detecting street sign. The goal of this sign would be two fold: to collect data on honking at various intersections, and then to discourage unnecessary honking by providing a visual reaction to individual honks and longer term trends. I came to this idea while listening to the amazing amount of honking that takes place outside my window on the Queensboro bridge. The prototypical bystander reaction to the frustration of incessant honking is to scream obscenities out of your window. I totally get this urge. However as a means of changing the behavior of drivers its almost completely ineffective. I take this as a sign of an unmet need; people want to communicate the frustration of living around a honk ridden intersection to the individual drivers who are presumably just passing through with little awareness to the plight of nearby residents. My hope is that this sign can communicate the collective feeling of neighborhood residents to the individual driver who isn’t aware of the compounding effect of their honking. I believe that such a sign will be effective because in my time spent listening to honking cars (against my will) I have learned that the decision to honk is highly informed by social dynamics.

Often honking will happen in clusters, as one particularly hurried or irritable driver starts the chain reaction by removing the slight stigma that exists. Eventually others will follow suit as if to signal agreement in their displeasure with sitting in traffic. In extreme cases when certain drivers feel their honks are being ignored (something I find insane) they will honk out a tune or simply hold down the horn until their non-verbal demands are met. Since honking operates within some discernible social system, I think this system can be altered by injecting a sign of displeasure to honking. Hopefully the number of “first honkers” can be reduced as they see statistics on honking or a visual representation of how their honks make residents in the area feel. For the “ignored honkers” I hope they will feel some slight shame or guilt when they see how honky of a day its been already, ideally they’ll realize that NYC traffic does not operate according to the whims of the individual and that their attempts to honk their way out of traffic is a tried and failed method.

Screen Shot 2015-10-29 at 4.32.16 AM

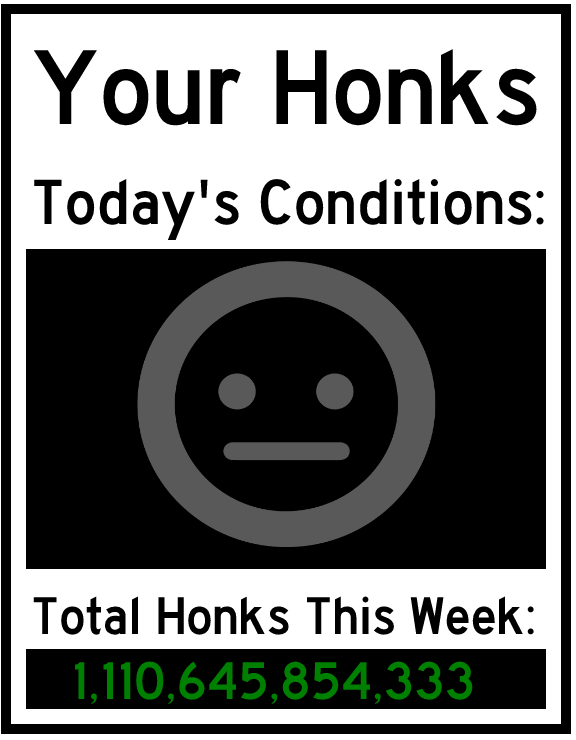
Here is my digital mock up of how the physical sign could look and function.

https://11bsouth.com/HonkSignMockUp/


Midterm – Sword Fight! | Pcomp #7

Ian (Yuan Gao) and I worked together to produce a sword fighting game with foam swords, digital sound effects, and a scoring mechanism for our PComp midterm. We had recently learned how to read the data from an accelerometer and how to serially communicate between the arduino and our laptops such that programming on the arduino can effect programming in p5.js and vica versa. We thought a sword fighting game would be a good application of these skills.

After consulting with Tom about our project he suggested we start out by visualizing the output of our accelerometers and using any patterns we noticed as a jumping off point for detecting sword motions like swings and hits. After a few attempts I put together a program in p5 that would graph the accelerometer data in a readable way, similar to what Tom had shown us. At the time we were hoping to use bluetooth communication so I set up bluetooth and attached the arduino to a battery as I tested my accelerometer graph.

Video:AccelerometerGraphing

As we studied (mostly played around) with the data output it became clear that acceleration isn’t always what it seems. Conceptually I understand acceleration as the rate of change of velocity. However, in practice I think I was expecting acceleration to act more like velocity or maybe “energy”. In addition, the constant acceleration due to gravity complicates the “movement” view of acceleration further. We looked into how to manage this data input and get it into a more usable state and we realized that in doing so we were entering the world of complicated math and physics lessons. One option in this regard was to calibrate the accelerometer to sense G force accurately. This would have made our measurements more accurate and legible but wouldn’t have necessarily helped us identify swings and hits. The other option we identified, and ultimately used, was to dive deeper into the meaning of acceleration and its derivatives. While we did research we discovered that a lot of people who work with accelerometers also work with the derivatives of the acceleration: Jerk and Jounce. Combining current accelerometer readings with the Jerk and Jounce allows you to determine points of inflection that could indicate the beginning of a swing, the end of a swing, a hit and other events. We ended up using a threshold value for jerk as the primary component of our swing detection, however it became very clear that it is possible to get accurate and distinct readings for a huge variety of motions depending on how much math and pattern recognition you are willing to do with acceleration, jerk and jounce. As a result, we spent a lot of time tweaking and experimenting with different values for each. In the end we included a lot of smoothing algorithms and this kind of threshold test for playing a sound:

function playbackChopSoundEffect(_jerk_vals, _jounce_vals, sample_ind) {
    if ((abs(_jerk_vals.x) >= _jerk_vals.max_x * 0.25 ||
    abs(_jerk_vals.y) >= _jerk_vals.max_y * 0.25 ||
    abs(_jerk_vals.z) >= _jerk_vals.max_z * 0.25) &&
   (abs(_jounce_vals.x) >= _jounce_vals.max_x * 0.33 ||
   abs(_jounce_vals.y) >= _jounce_vals.max_y * 0.33 ||
   abs(_jounce_vals.z) >= _jounce_vals.max_z * 0.33)) {
   if (random(1) > 0.5) swoosh_sounds[sample_ind].play();
   else swoosh_sounds[sample_ind + 2].play();
}
}

If we had more time for research we may have been able to rely completely on the accelerometer to detect all of the possible sword events however we settled on having the accelerometer control swing sounds and to use home made switches for hit detection (scoring) and to play a sound when two swords hit each other.

Attaching the accelerometer to the foam swords, building the p5.js sketch to detect and respond to the action and wiring this all up was tricky but took much less time than the calibration of the accelerometer. We wrapped each sword in tin foil and built companion targets (also wrapped in tin foil) to form switches when the opponents word makes contact with your sword or your target. The accelerometer was attached to a mini breadboard which we zip tied to each sword. Unfortunately we didn’t have time to make this wireless so each sword had a long trail of wires connecting them to the arduino. The sketch incorporated some fencing images and sounds that we found online (citation coming) as well as the score count for each player.

IMG_1701

Screen Shot 2015-10-29 at 6.54.16 PM

I was happy with how this project turned out. Some problems were the lack of wireless which would have made the game more fun due to the increased freedom of movement and the relatively fragile nature of the swords and electronics we fabricated. I’m confident that with more time, resources, and guidance we could make this game fully wireless, self contained (wouldn’t require a PC connection for the sounds and scoring), and more durable.

Here’s a video of it in action:

SwordFight!


Evil Peeps w/ External Game Controller (Serial Communication) | Pcomp #6

The task for week 6 was to “make a serial application that controls one of the animation projects you’ve done in intro to computational media with analog sensor data from an arduino, sent to the browser serially” so I decided to give my evil peep game I’ve been working on in ICM an external controller.

The evil peep game was relatively easy to adapt for an external controller. Origionally the Evil Peeps would appear at the pointer of the mouse on screen at an increasing rate. The challenge was to continue placing peeps without overlaps even as the time between new peeps and the available space on the screen were shrinking. To adapt it for an external controller I first copied in all of the serial communication set up (listing available ports, error checking, etc…)  that was made available to us in the serial communication Lab. Once I got the arduino and the sketch to communicate I added an if statement so that if the peeps game received a signal for a button press from the arduino it would look for all controls to come from that device and ignore the mouse. This allowed the game to be played either the standard way or with the game controller. The next step was to add the controls.

At this point measuring the output of a sensor and mapping it’s values is something I’ve gotten comfortable with so having the arduino read two potentiometers was straightforward. I assembled my arduino with one button input and two potentiometer inputs and stuffed it into a used milk carton.

IMG_1643

I programed the arduino to serial write the value of each potentiometer and the button as a series of values, like this: “125,125,0” – This would indicate that both potentiometers are close to half their maximum resistance and that the button is not pressed. In p5 I read these values, split them up, mapped the range in values to the size of the screen, and stored each in an array. Once I had these values coming in reliably having them control the game was just a matter of replacing mouseX and mouseY as the basis for the peep locations with the mapped potentiometer values stored in the array. Controlling the game with the potentiometers made it significantly more difficult so I spent a lot of time adjusting the score and Peep timers until I got it to a playable format. In the end I was really happy with how it turned out and I think I’ve developed a much deeper appreciation for classic arcade games!

Video:

Evil Peeps With Controller


  • one issue I had was that after stuffing my arduino in the box the button became unreliable – the solution would have been to get a better button

Color Composition | Visual Language #6

This week we were asked to look into color composition. Being a very colorblind person I wasn’t sure how successful I’d be at this but I ultimately realized that I can leave some color decisions to the color wheel and have a reasonable expectation that they would “work” as a composition even if I could’t see it properly. Taking the color perception test was interesting too because I actually felt like I was doing a decent job until I got a score at the bottom of the perception range.

Screen Shot 2015-10-26 at 10.37.42 AM

The funny thing about being colorblind is that its hard to notice until someone tells you. If this challenge lacked a score I would have felt pretty confident that I did well. I think that this is the primary frustration with this minor disability, it’s existence is largely social.

When trying to create a composition I tried to rely on some of the color relationships we learned about on the color wheel. I made a weather displaying sketch that changes color (and some other properties) as we weather and time of day changes. The range of hues is determined by the temperature where I mapped a range of 0 to 100 degrees to 0-330 degrees on the color wheel. The background is then set as an adjacent color by adding 30 degrees and the boarder is set as the complement of the background. Here are some of the ranges with a fixed saturation and brightness.

Screen Shot 2015-10-26 at 10.41.15 AM Screen Shot 2015-10-26 at 10.40.49 AM Screen Shot 2015-10-26 at 10.40.34 AM Screen Shot 2015-10-26 at 10.40.21 AM

Next I varied some of the brightness levels of the background to correspond with the day/night cycle:

Screen Shot 2015-10-26 at 10.42.10 AM Screen Shot 2015-10-26 at 10.41.58 AM Screen Shot 2015-10-26 at 10.41.41 AM

I didn’t want it to ever get completely black so I set the range of the background and border to vary between 50-100 brightness depending on how far away from mid-day it currently is. Lastly, I adjusted the saturation of the background and border. I wanted the circles to be the primary temperature indication so I set the saturation of the background to 50% and the border to 25% while leaving the dots at 100%. Screen Shot 2015-10-26 at 10.43.02 AM

I hope that this isn’t a totally weird collection of colors 🙂

Screen Shot 2015-10-26 at 11.15.54 AM Screen Shot 2015-10-26 at 11.15.43 AM Screen Shot 2015-10-26 at 11.15.26 AM Screen Shot 2015-10-26 at 11.15.13 AM Screen Shot 2015-10-26 at 11.14.58 AM


https://11bsouth.com/DataBouceTemp/


Data week | ICM # 7

This week we were asked to look at incorporating data sets into or sketches. I felt a little shaky on some of the topics covered in the past two weeks so I followed some examples from Dan Shiffman’s p5 videos to re-familiarize myself with constructor functions as well as some other concepts like using different tabs. After completing Dan’s example I customized things a bit to have a series of circles bouncing off of one another and the edge of the window.

At this point I tried to incorporate some external data into my sketch. My first attempt was to use data from (https://collegescorecard.ed.gov) which actually provided a lot of helpful documentation and examples.

Screen Shot 2015-10-21 at 11.10.21 AM

I think I was pretty close to getting this data set to work but after spending a while frustrated by a blank loading screen I decided to look at the openWeather examples I had seen in the p5 reference.

With openWeather I used a call back function to take individual numbers out of the JSON file and set them as universal variables in my sketch. I used the temperature to set the number of circles on the screen and wind speed to give them a range of starting speeds.

Screen Shot 2015-10-21 at 11.13.34 AM

I ended up with my sketch reliably producing the desired results.

Screen Shot 2015-10-21 at 11.13.48 AM

I hope to do a lot more with data while at ITP so it was really interesting to start looking at APIs and the differing file formats. I’m going to review DOM material this week and I expect using some DOM elements will really expand what I can do in terms of utilizing data.


sketch https://11bsouth.com/DataBounce/