Here is a demo version of the Honk Box with pre-recorded street sounds and honking (Honk Box) (video) .
 Overview and origin:
Honk Box detects, records and reacts to car horns. As Honk Box hears more and more honking it updates its expression to reflect either approval, disappointment, annoyance, or sadness. In the demo version the expression updates as total honks in that particular session climb higher as well as during individual periods of intense honking.
I developed Honk Box as a way to document and hopefully reduce noise pollution around major intersections.
The bridge I live next to is loud all day and night (DNAinfo). The goal of Honk Box is for it to be displayed in the view of drivers, reacting in real time to honking. Part of the inspiration for this project is the “Your speed is…” signs that are meant to encourage drivers to slow down. The idea is that if people know their behavior is observable, pollutive, and potentially shameful they may be less likely to engage inthat activity. Noise pollution, especially from cars, has become a more pressing issue as transit infrastructure in general becomes more congested and urban density has increased.

Honk Box detects honks my measuring the number of continuous loud peaks in the ambient sound. By default if more than 3 peaks of sufficient loudness persist for more than 1/8th of a second a honk will be counted. The settings panel can be used to adjust sensitivity.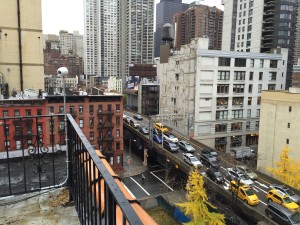
Process:
Honk Box originally started out as an idea for my physical computing final. I envisioned a physical box that would look like a street sign with an LED light board to display the faces and the total honk count. However in considering the amount of programming involved in the project and my lack of fabrication skills at this point I decided to make a web based version instead. While considering this transition from a physical device to a web app I decided that as long as it lives on the web it should be usable/deployable in a number of different contexts and on a wide range of devices. As such I spent a great deal of time making sure to incorporate design that was responsive to screen sizes so that it could be run on phones, tablets, or computers. In addition I decided I wanted some form of control panel so users could adjust the honk detection variables to suit their needs. Currently honk box is adapting well to most devices I’ve tested it on but I have run into some browser issues that I hope to iron out.
Another feature I really wanted to incorporate was data logging. I feel that the problem with honking is that it is very disruptive but at the same time ephemeral and semi-anonymous. This makes policing and assessing the problem difficult. So in addition to the emotional feedback the face provides to drivers I thought I would be valuable to have a record of just how “bad” honking really is at any given location over time. Unfortunately this data feature is not fully implemented but it is something I’d like to return to when I have a better idea of how to store and organize the data. This did however lead me to create the data screen which shows the FFT and spectrogram analysis of the live sound.
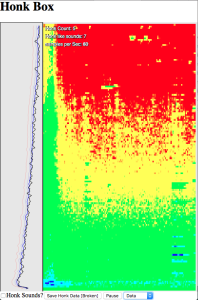 Developing and learning about spectrogtraphs was a major tuning point in how I was attempting to detect the honk sounds. Prior to building the spectrograph I was relying on a mixture of loudness detection and a sum of least squares comparison between previously analyzed “honk Sounds” and the average ambient sounds. This method kind of worked but could easily be fooled by other loud sounds such as motorcycle engines and kneeling busses. Seeing how the spectrograph represented the honk sounds I realized that honks are relatively distinct in the pattern they create. Where as most street sounds tend to either flood all frequencies or move through a number of frequency ranges honking created nice flat lines across the spectrograph. Ultimately the honk detection I used would seek out these “lines” in the sound which allowed me to filter out most false positives. So while the current data tab was originally a calibration and development tool I left it in as part of the final program so that end users could adjust the settings in response to the same sound behaviors I saw but in their local environment.
Going forward I will be thinking about ways to improve this system. A couple of directions I’m already interested in include using machine learning techniques to better identify honking, and using some database technology to store honk data from multiple locations simultaneously.
Please contact me with advice, comments, or questions.
Acknowledgements:
Reaction faces come from the Noun Project and were created by Dani Rolli
I received a ton of help from Josh Kramer on sound analysis, as well as Peter Glennon and Alec Horwitz on programing.

